Within the education industry, there are various types of taxonomies or classification systems. The most commonly understood of these is Bloom’s Taxonomy, a hierarchical framework used for learning. Bloom’s is an excellent example of a taxonomy designed to give structure and meaning to learning experiences and how we design them.
But taxonomies and other forms of mapping are used more widely across education than many people realize. In this article, I’ll provide a brief overview of taxonomies, what they’ve historically been used for, and the ways in which they’re evolving today.
So what IS a taxonomy in this context?
A typical taxonomy involves the correlation of course content across multiple titles owned by a single entity, such as an educational publisher or other content provider. A decade ago, a taxonomy of this type might have focused mostly on A-heads and B-heads (primary and secondary heads covering broad topics within a chapter or module of content). The taxonomy might have compared the A-heads across comparable chapters in multiple textbooks, essentially creating a map that the publisher could use to assess which of their titles covered what content. A taxonomy of this type might start with content mapping, often done in Excel or another tabular form, that looks something like the following (assuming Statistics as our subject matter):
| Topic | Product A | Product B | Product C |
| Descriptive Statistics | |||
| 2.1 Using Descriptive Statistics to Summarize Data | 2.1 Understanding Statistics that Describe the Data Set | 2.2 Descriptive Statistics | |
| 2.2 Tables | |||
| 2.3 Measuring the Center: Mean vs. Median | 2.2 Means & Medians |
2.3 Means 2.4 Medians |
|
| 2.4 Variation and the Standard Deviation | 2.3 Understanding the Standard Deviation | 2.5 Variation |
Ultimately, the above table shows an important piece of what eventually becomes the taxonomy. It maps the content across multiple titles and finds the commonalities. It also clearly identifies the gaps—for example, Products B and C don’t (ostensibly) include a section that explicitly compares means and medians. However, it’s worth noting that the individual sections on means and medians might cover the differences. A good mapping structure will also go deeper than the basic shell shown, down to B or C level sections, in order to give a truly comprehensive view of all content being analyzed.
This type of analysis is frequently done to compare a product against other content bundles owned by the content provider and against those of competitors. It helps the content owner to do a gap analysis, assess their potential position in the market, and plan updates. Maybe some coverage of tables is a really big deal to the market, in which case identifying that Product A has it, and others don’t, means something (statistically, no less!).[1]
So, how does this (admittedly boring) grid become a taxonomy? Well, by studying commonalities across multiple “things” (courses, modules, textbooks, whatever), we can create a hierarchical structure of what is taught and in what order (broadly, as opposed to in a single title or course). That broad taxonomy provides an outline of what is valued in this particular field, and the typical order in which content is presented. In the above example, the reasons are fairly obvious—a learner can’t understand more complex statistical analysis if they don’t already understand the basics and why they are important.[2]
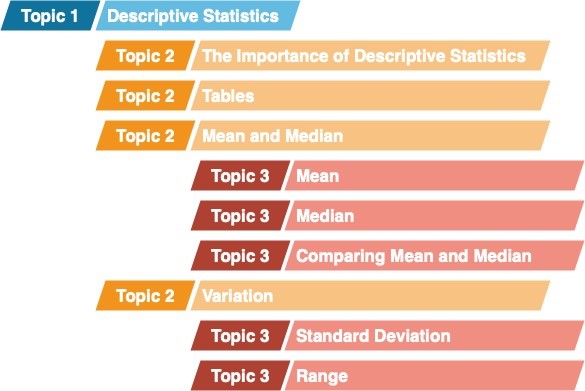
The taxonomy ultimately takes the form of an outline, such as the following, which includes topics covered in all three of the sample items compared[3]

And…how is a taxonomy used?
Taxonomies have multiple uses in course content planning in education. Among the most common are:
- Market Analysis + Revision Plans: A tabular form of a taxonomy (or really, less a true “taxonomy,” and more the mapping grid shown earlier) is a quick and easy way to complete a gap analysis, i.e., a way of seeing “what’s missing.” Content providers/creators can easily compare the topics covered in their most popular content (or that of a competitor) against content that they want to update. That in turns drives the revision plan, which is a detailed listing of what needs to change in order to provide more useful, current content.
- Industry Standards Mapping: Content creators can take the topical mapping a step further and compare content to industry standards, such as CACREP (social work) or ASE (automotive). Doing so helps the content creator provide a learning experience sufficient to prepare learners for professional certification exams.
- Authoring of Universal Learning Objectives[4]: In other cases, the taxonomy is used to create shared, or universal, learning objectives that can be used across multiple “chunks” of content. These, too, can be mapped to industry standards. The end result is a holistic view of a given entity’s suite of content, and which pieces are designed to fulfill which learning objectives. This allows instructors to more easily create custom products (e.g., let’s say that Instructor A feels Course 1 covers Topic B the best, but that Course 2 covers Topic C the best. They can use the taxonomy and mapped learning objectives in planning their own custom course, as opposed to feeling as though they are tied to one particular product that maybe does some—but not all—things well).[5]
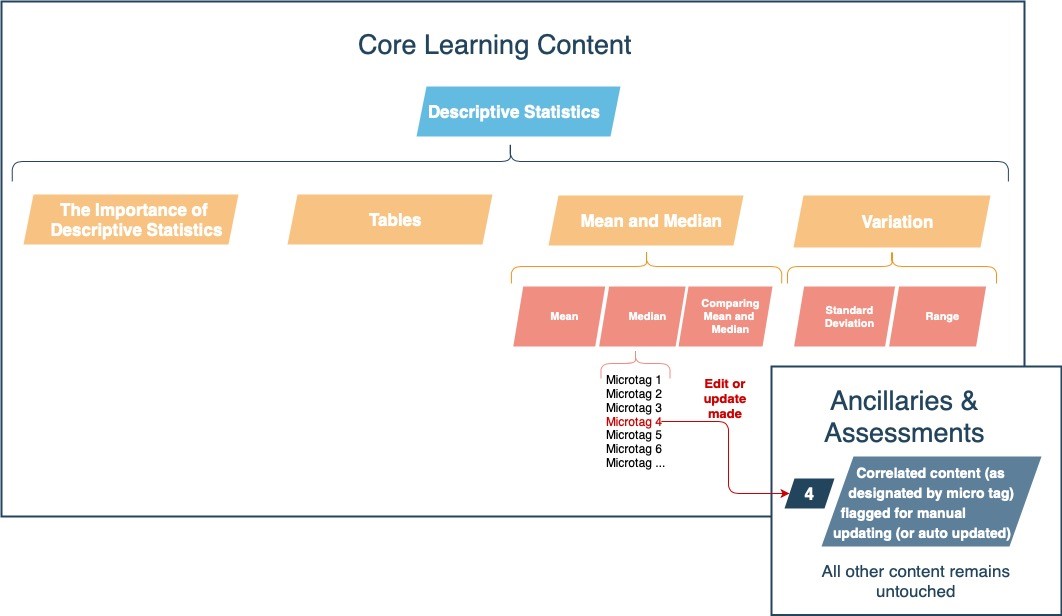
Another use case for taxonomies is their more granular form—microtags. Creating microtags and applying them to course content even further unbundles the content, and (especially important for Lumina, working in educational content transformation) allows for targeted and iterative revision. An application of this approach would be:

While they may not (at first) seem like the most glamourous of educational content types or tasks, there is an undeniable case for the use of a taxonomy and its subsequent derivatives, whether they include standards mapping, learning objective design or correlation, or applying microtags in order to more efficiently and quickly make key content revisions.
Interested in learning more about how Lumina approaches the creation of taxonomies, universal learning objectives, or microtags? We want to hear from you! Email our team to learn more or visit our website to learn more about Lumina Datamatics.
Notes:
[1] A timelier example of this is likely the inclusion, or lack thereof, of data analytics. Often thought of as a field in and of itself, more and more industries and areas of studies consider at least a basic understanding of data necessary. This begs the question of whether one day an understanding of data will be akin to comfort level with MS Office, or basic computer skills—essentially a necessary, if unstated, skill that is required for many professions.
[2] This is true of every industry and every educational discipline. There would be no penicillin without a chemist who already understood how to use a Petri dish, and no combustion engine without scientists who understood the laws of thermodynamics.
[3] An important factor to remember is that nothing can be everything, at least not successfully. The likelihood of a single title or course including every possible topic is extremely low (and if such a thing existed, it would be monstrous and no one would want to use it). This is the reason that multiple courses or titles need to be assessed in order to create a valid taxonomy.
[4] A caveat that proponents of backward design—or really, any instructional designer worth their salt—will immediately say, “but wait! Good learning designers will write the student outcomes or objectives first, not author them based on a taxonomy that already exists.” And they wouldn’t be wrong, in the ideal scenario. But this particular piece is focused on potential uses of taxonomies, which as outlined here, are often created from preexisting content.
[5] In regard to the final bullet above, it’s interesting to take into consideration that the taxonomies and LOs I’m discussing are those typically found at educational content providers, who (I assume) created them with an eye toward increasing or maintaining their market share in an increasingly competitive landscape. The irony in that is that doing so comes with both pros and cons—the content is itself more discoverable and unbundled from the larger product, should someone want to use only a “chunk” of the learning content. The downside is, of course, that the individual pieces are where the value ultimately lies. Worth watching is what the newly announced edTech Argos Education plans to do in this space. My hope is that their Sojourner platform will encourage and enable the easy customization of paid chunked content from anywhere and everywhere, along with some way of including OERs. This is one new edTech player I’m personally excited about!


0 Comments